Data analysis is essential to reduce consumption and increase savings
Interested in finding out how to make your home more energy efficient and see a tangible decrease in your bills? Have you ever wondered how you could have full control of your consumption, avoiding unnecessary waste?
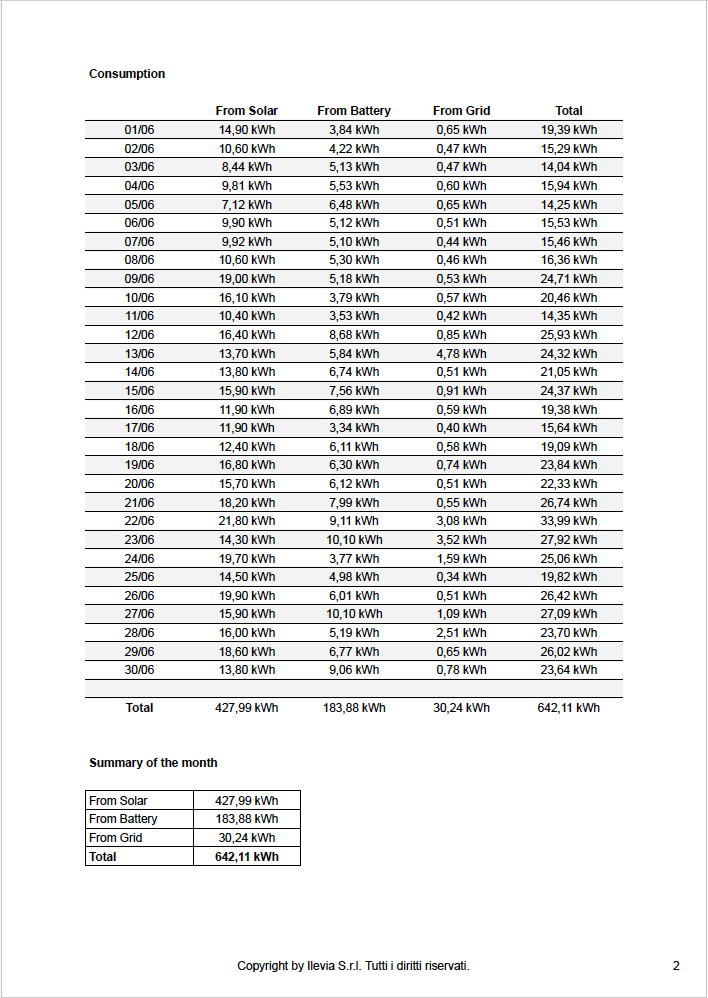
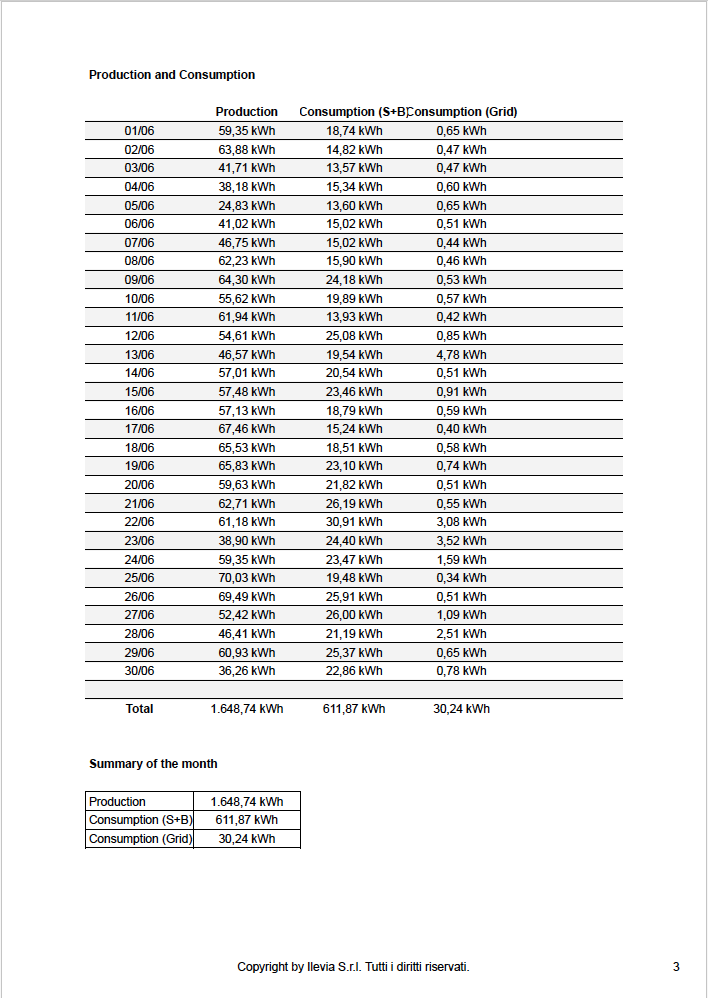
Reducing consumption and increasing economic savings is a goal that can be achieved through the application of energy efficiency logics. However, the first essential step on this journey is awareness of how we use energy. That’s why monitoring energy consumption is the foundation of any energy efficiency effort. When we are aware of how and where we are using energy, we become able to identify areas where improvements can be made. This can include adopting more energy-efficient equipment, optimizing heating and cooling system settings, programming devices to turn off when they’re not needed, and much more. The analysis of energy consumption data provides us with valuable information to make decisions based on facts, rather than assumptions. With Ilevia the monitoring activity is extremely simple. At any time and wherever you are, you can conveniently access the App and view energy production and consumption charts. Not only that, for an even more careful study it is possible to export the data to Excel to consult history and charts both on PC and on printed paper. To achieve this, the Report function comes in handy, a fundamental tool for helping users understand their consumption.
Energy Data and Charts
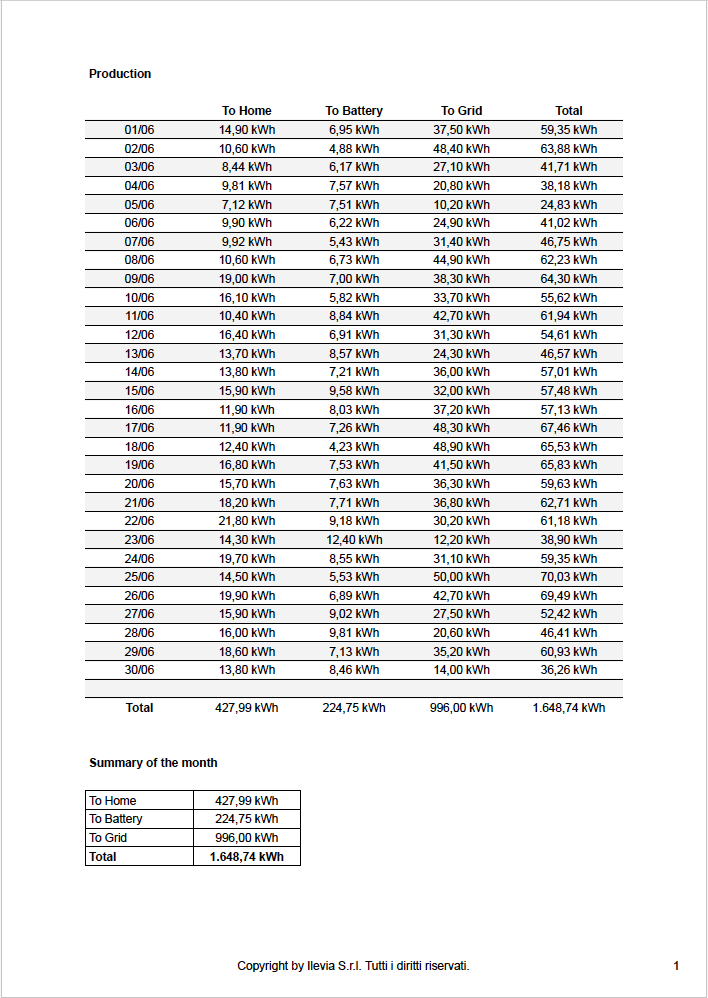
Reports offer a valuable resource. Thanks to this functionality, it is possible to periodically receive a summary of the collected data presented in Excel format directly via e-mail, as well as their representation on a chart. Users have the option to choose the frequency with which they wish to receive reports (daily, weekly, monthly, yearly), thus adapting monitoring to their specific needs. They can opt for the models made available by Ilevia or design new ones making the analysis even more accessible. Reports are not just information documents; they are a tool that allows users to more precisely analyze how energy is used. Users can spot trends over time, identify peaks in consumption, and evaluate the impact of their actions over different time scales. The reports not only provide data, but give users a powerful magnifying glass through which to examine their energy consumption and make decisions to create a more efficient home environment.
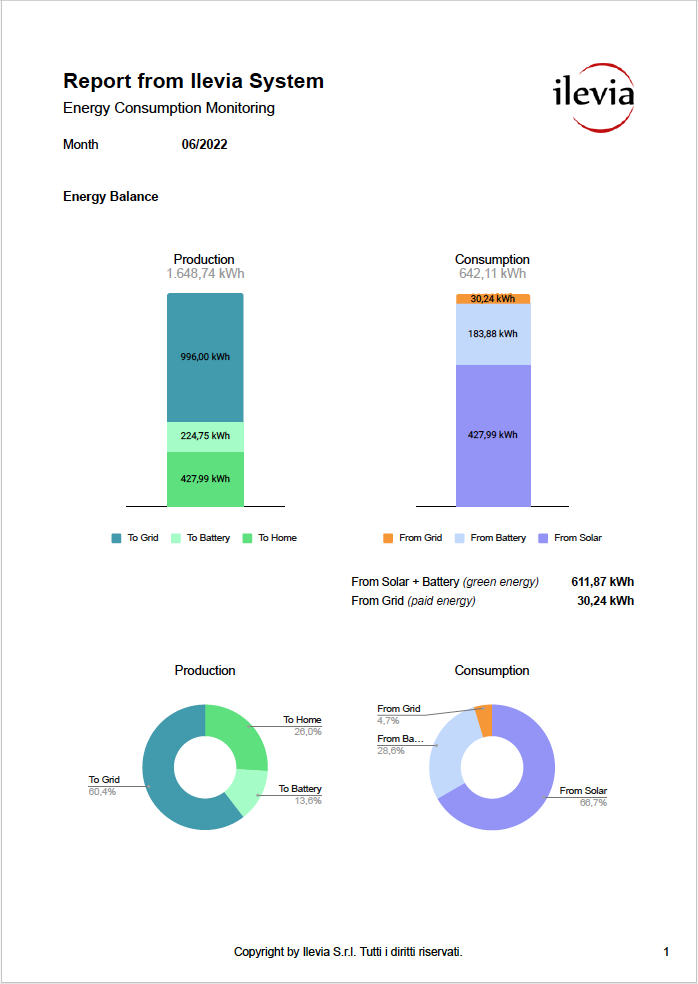
Energy Balance Report
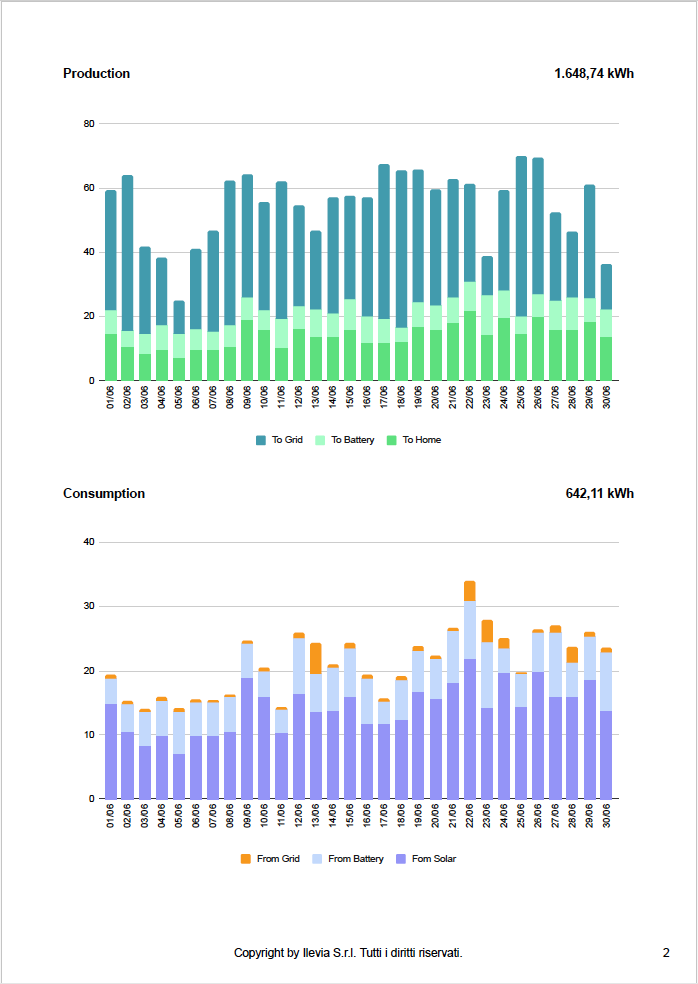
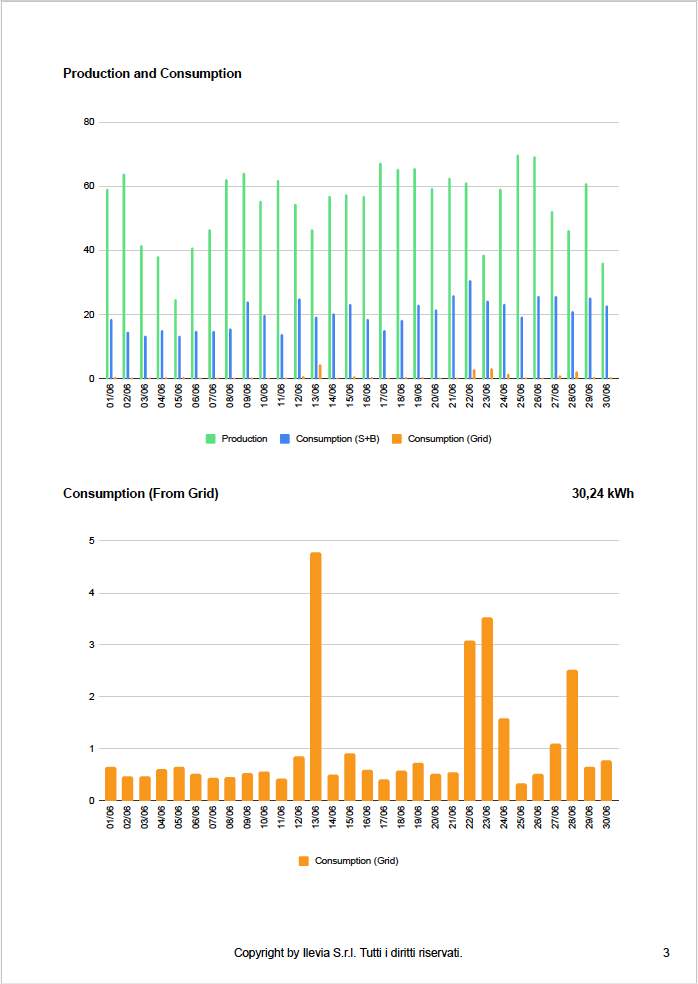
Energy Charts
Report Mensile – I grafici dei Report Excel utilizzano i dati raccolti dal sistema. Iniziamo con un riepilogo mensile confrontando la Produzione e il Consumo di energia attraverso chiari grafici a colonne e grafici ad anello. Successivamente, esploriamo i dettagli giornalieri di Produzione e Consumo energetico, con una suddivisione tra Casa, Batteria e Rete sia per la Produzione che per il Consumo. Infine, un grafico speciale mette in evidenza la tendenza mensile nell’acquisto diretto di energia dalla rete, aiutandoci a comprendere meglio i nostri comportamenti di consumo energetico nel corso del mese.
Energy Data

